PRECONDITIONS
In order to see the Live View, you need to fulfill the following requirements:
- Your Administrator must complete the Nimbus Installation.
- Afterwards, you can begin Service Provisioning and add a Nimbus tab to your team. The Live View will be part of your team's Nimbus tab.
Overview
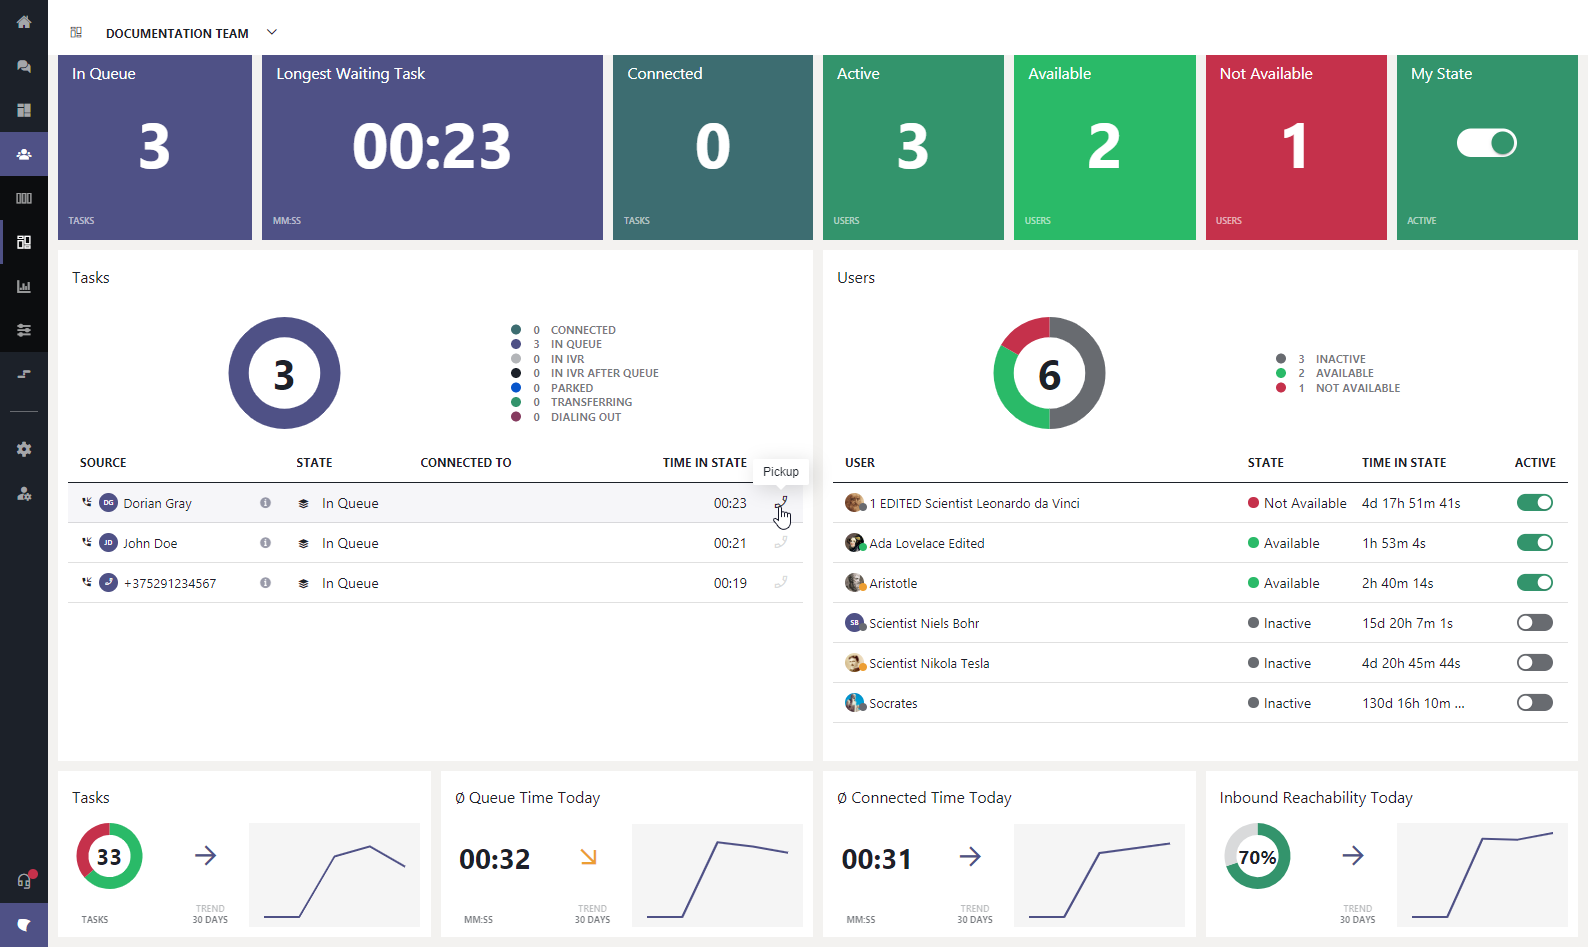
The Live View shows current activities in the team, users states and some team statistics. This page is available to all team users regardless of their team role or current status.
💡 You can always return to the Nimbus Live View tab: select the team and channel where Nimbus is installed, then click the "Nimbus" tab on top, then click the "Live View" icon in the sidebar.

The Live View consists of widget elements with various purposes:
| Name | Description |
|---|---|
|
Tasks Widgets (left area) |
Task Widgets summarize incoming tasks displaying the most important metrics on top. The purpose of the Tasks widgets is to:
|
|
Users Widgets (right area) |
The team users and status widgets summarize team availability with the most important metrics on top. The purpose of the Users widgets is to:
|
|
Trend Widgets (bottom row) |
Trend widgets summarize team KPIs, both daily and in a 30-days trend Their purpose is to:
|
Handling Tasks
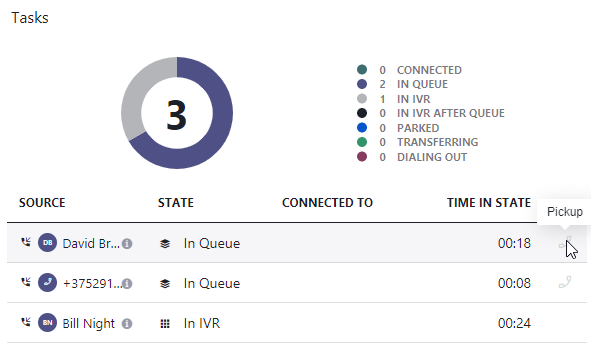
Nimbus can operate in different Task Distribution methods for each service. Accordingly, the "Tasks" widget on the Live View combines these methods as specified by the service's Workflows.

OTHER WAYS OF HANDLING TASKS
- Regardless of task distribution type configured within Service Settings, any Microsoft Teams interaction that handles Nimbus Tasks will behave in the same way as you already know them from regular calls.
- Tasks will be distributed to you when "Active " in the user list and in a User States that Nimbus considers as "Selectable". You can leave the Nimbus Live View to focus elsewhere.
- When your Distribution Service Settings and Workflows are configured to distribute calls automatically (and not via "Pickup" controls in the Live View itself), Nimbus can operate completely in the background if needed.
- Adaptive Cards can be optionally enabled as part of your Service Settings. A Teams channel will display "Adaptive cards " with pickup controls (same as the Live View) and options to listen to recordings.
Many other views in Nimbus – e.g. My Sessions or Attendant Console – allow you to accept calls via pickup and handle tasks in a similar fashion. You can work with your personal preference.
Managing user availability states
Nimbus tracks active users in the Live View in real-time. Whenever you or one of your team colleagues changes this "Active" state, it will be immediately reflected.
The following columns and status are displayed:
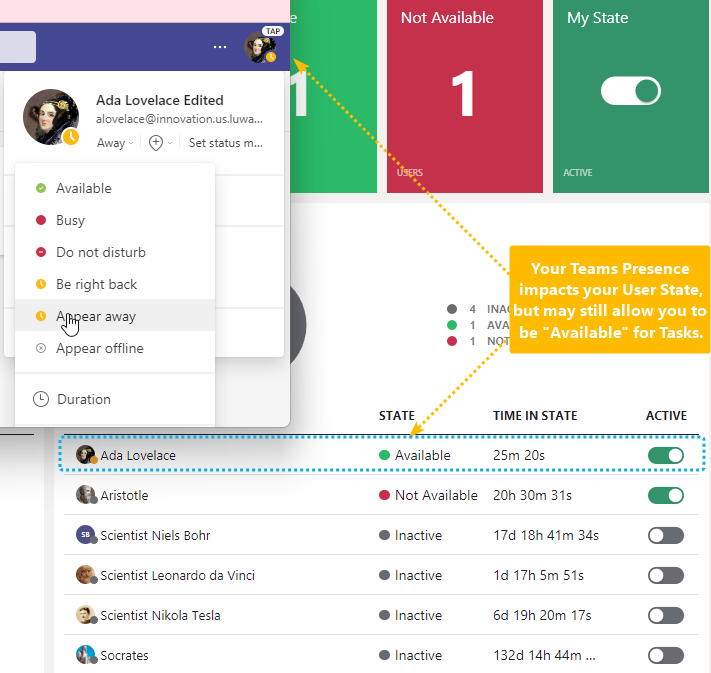
EXTERNAL STATUS DEPENDENCIESThere are several factors influencing User State and Nimbus service availability:
|
An example how you can be available while "Away" in MS Teams
|
Evaluating service KPI trends
As part of the Nimbus reporting the evaluation widgets continuously monitors service KPI metrics. Out of the data gathered, trends will be displayed on the Live View in real time.

The widgets can be separated into several concepts:
Daily Metric (Numeric) |
Trend Arrows (Colore and Direction) |
Historic look-back (Trendline Chart) |
|---|---|---|
|
Showcases the main metric gathered for the current productive day (data gathered starting at midnight). Metrics gathered are as follows:
|
The trend arrows highlight a comparative trend. The baseline for that trend is the standard deviation taken from data metrics mean average gathered in the last 30 days. A tendency is signaled in both direction and color:
|
The trend chart is a historic comparative look-back on the last 5 productive days of operation . Data point reflects the same time of day on previous productive days.
|
RELATED TOPICS
🔍 KPI Settings: Note that reporting (SLA) metrics configured in each Service's General Service Settings directly impacts metrics and trends.
Other places to review data:
- SLA metrics gathered in Live Views are also shown in Reporting.
- The Historical Sessions view allows to dive deeper into individual (concluded) sessions and their results.
- Contact Center users can leverage (Non-) Personal Dashboards, which are customizable with Dashboard Widgets and individual filters.
- A full historical report can be generated in Power BI, where Nimbus KPI Calculations apply.
